
With the new Geo Web Analytics functionalities, we are offering a tailor-made solution for purposefully analyzing and dynamically illustrating the concrete usage of the digital services being offered to map.apps providers. service.monitor Analytics seamlessly intergrates into map.apps Manager, because it has been developed on con terra's solution platform. It immediately benefits from the proven system design of map.apps.
Gain new insights
Wether a developer, administrator, IT services or the operating oragnisation, all have specific views, interest and duties regarding the provisioning of map.apps applications. What they all have in common is the challenge to compare exepectations on the usage of an application with the reality. service.monitor Analytics bridges this gap with map.apps-based logging and analysis bundles, which can be simply added to the map.apps bundle system.
For the first time, it is possible to get simple answers to concrete, tailored quesitons regarding the usage potential of what is offered.
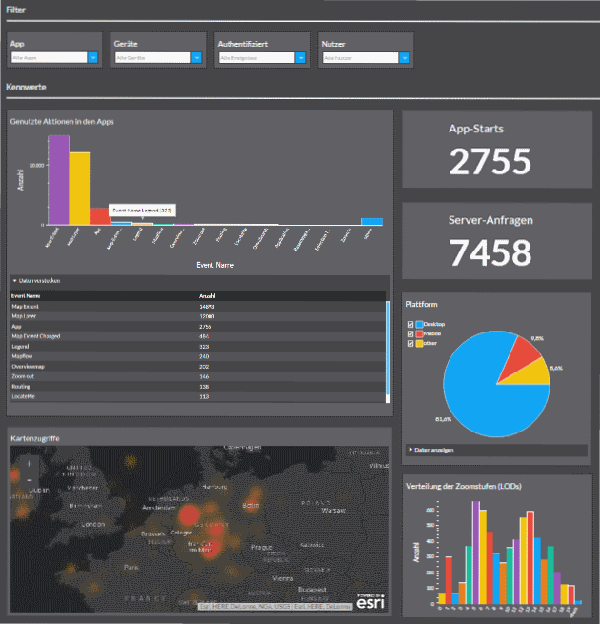
- Are the applications being used in accordance with my expectations?
- Which functions do users prefer?
- What are users searching for? Which Omni Search sources are heavily being used?
- What terminal devices and operating systems do my users run?
- What map services do they use and what regions are they particularly interested in?
- Are there currently errors occurring in some apps or with certain browsers?
Answering those question will help service providers of map.apps applications to run their daily business in a more service-orientated, user friendly and more stable manner. The feedback of user behavior in real-time to the administrator opens fast and agile reaction possibilities in terms of continually optimizing and improving user experience.
Get operable and productive quickly
service.monitor can be put into existing map.apps applications at lightning speed, in terms of both production and use. First, upload the bundles and configure, then install the back-end services with a mouse click. More is (almost) not needed to bring it into operation. Preconfigured dashboards provide immediately useful first analytical views on the use of own services, regardless of which view you have on the system. Backend services consist of processing pipeline Logstash which has been adjusted speficially for the needs of Geo-IT services. The role of data store and search engine is fulfilled by ElasticSearch engine provding a superior query performance.
Analytics dashboards offer most diverse, interactive and combinable filters for dynamically adjusting the analyses. Instead of using the data of all collected user interaction data, views can be generated to focus of the usage of specific app, operating systems, terminal devices and much more.

Data can be filtered temporarily, parameters and properties of the user's runtime environment can be analyzed, likewise the usage of content and functions of a single app itself - everything dynamically and simple via the preconfigured dashboards.
Integration from a single source
service.monitor Analytics is so seamlessly integrated with map.apps, that map.apps Manager becomes an even more essential tool for controlling digital service provisioning. Wether app and bundle managment, user administration or monitoring of service operation with service.monitor, everything is smoothly integrated with each other and provides a continous user experience. This simplifies adminstration of service provisioning and increases the productivty of the services in general.
Through flexible architecture and con terra's system design patterns, the integration of Analytics into other products is simply possible. This enables the analysis of the usage of security,manager's secured services or access on smart.finder SDI.
Customer acceptance and customer satisfaction via Geo Web Analytics
Successful operation of digital service is much more than putting an application and some services onto a server. Sustainable success and customer satisfaction are the result of a flexible and maintainable platforn architecture, simple and focussed usability and, most notably, the ability to understand how users interact with services. service.monitor Analytcs creates this transparency, increases customer acceptance and in turn, cares for high cost efficiency.
Highly configurable
Anything is possible. Analytics is configurable and multi-purposely extensible. Self-designed dashboards, self-created analysis queries for concrete (and quite specific) issues, self-developed charts and diagrams are all possible as well as the extensions of logging data model in app. Even custom bundles can profit from this functionalities.
- way of functionality and system design
- create and configure dashboards
- create diagram widgets on example of a scatter plot chart type
- integration into and analysis of the usage of other con terra products
- and much more....