
service.monitor 4.2.0 brings noticeable improvements in the configuration of the Analytics dashboards. Dashboards can either use the globally predefined widgets of the product or define queries locally in the individual app. A blog article that will be published in the next days will explain the advantages of the new configuration step by step.
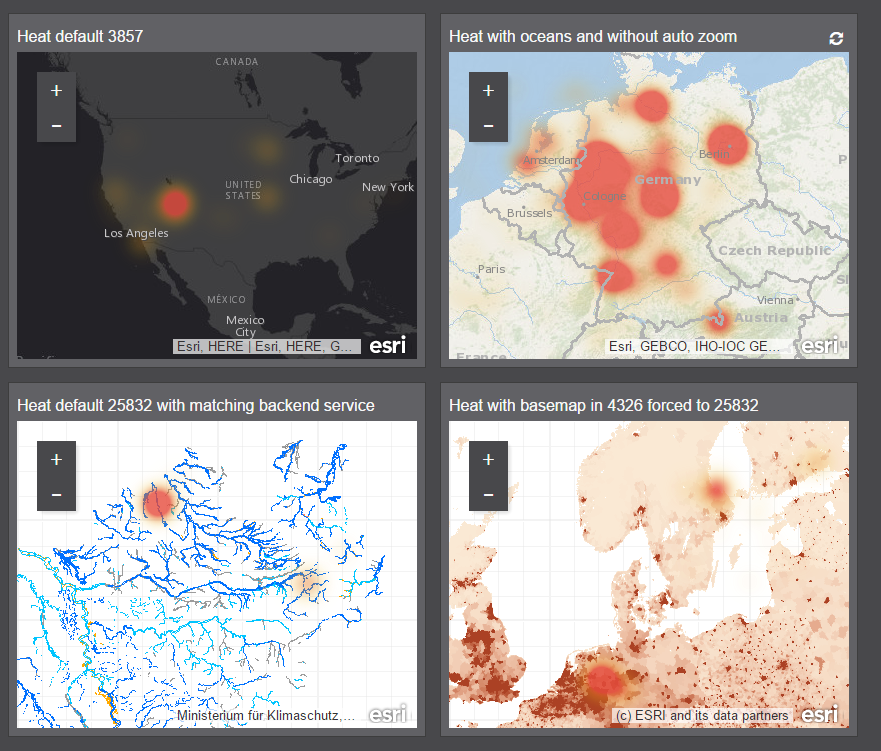
The heatmaps for the representation of specific areas of interest are also more flexibly configurable and can be used in further spatial reference systems.
The product documentation available in the Developer Network provides an extended description for the maintenance and configuration of Elasticsearch, in order to optimize the overall data index with regard to performance.
In the field of monitoring, con terra products and Elasticsearch can now be monitored more precisely, i.e. service.monitor can let you know if no Analytics events have arrived in the index at a certain time of a day.
As an additional notification channel, Slack, a cloud-based collaboration platform for teams, has been added. In the field of reporting and statistics, the user can now define free evaluation periods in order to calculate availability or, for example, an average response time.
All further information on the release is listed in the release notes.